Outcomes
Improved Provider Experience and Care Quality
Interested in reading a reference cited on this page? They can be found
here:
Home / The Practice Problem / Literature References.
Key Findings
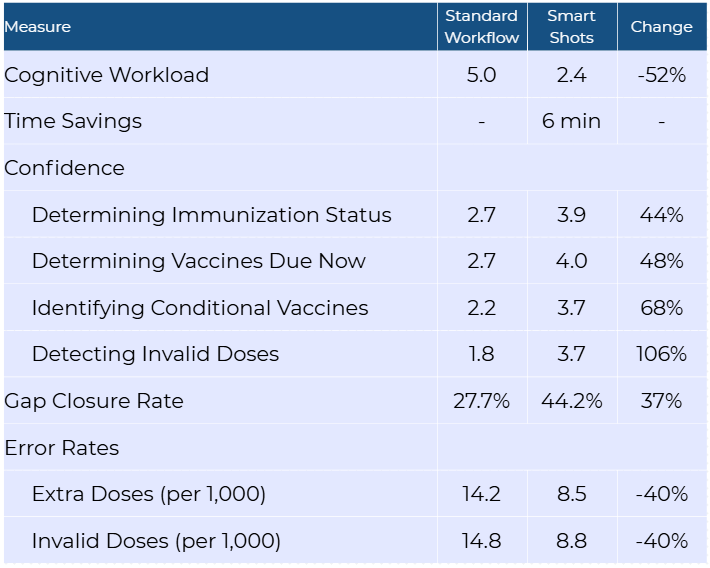
The Smart Shots project demonstrated significant improvements in three provider outcome measures: provider cognitive workload, task efficiency, and confidence in pediatric immunization management. This reduction aligns with the project goala of enhancing the cognitive aspects of immunization management by decreasing reliance on working memory and reducing cognitive load. Additionally, analysis of quality measure data collected during the project revealed reduced administration error rates and improved gap closure rates when the intervention was applied. These findings correlate with improved task accuracy and decision-making when cognitive workload is reduced.
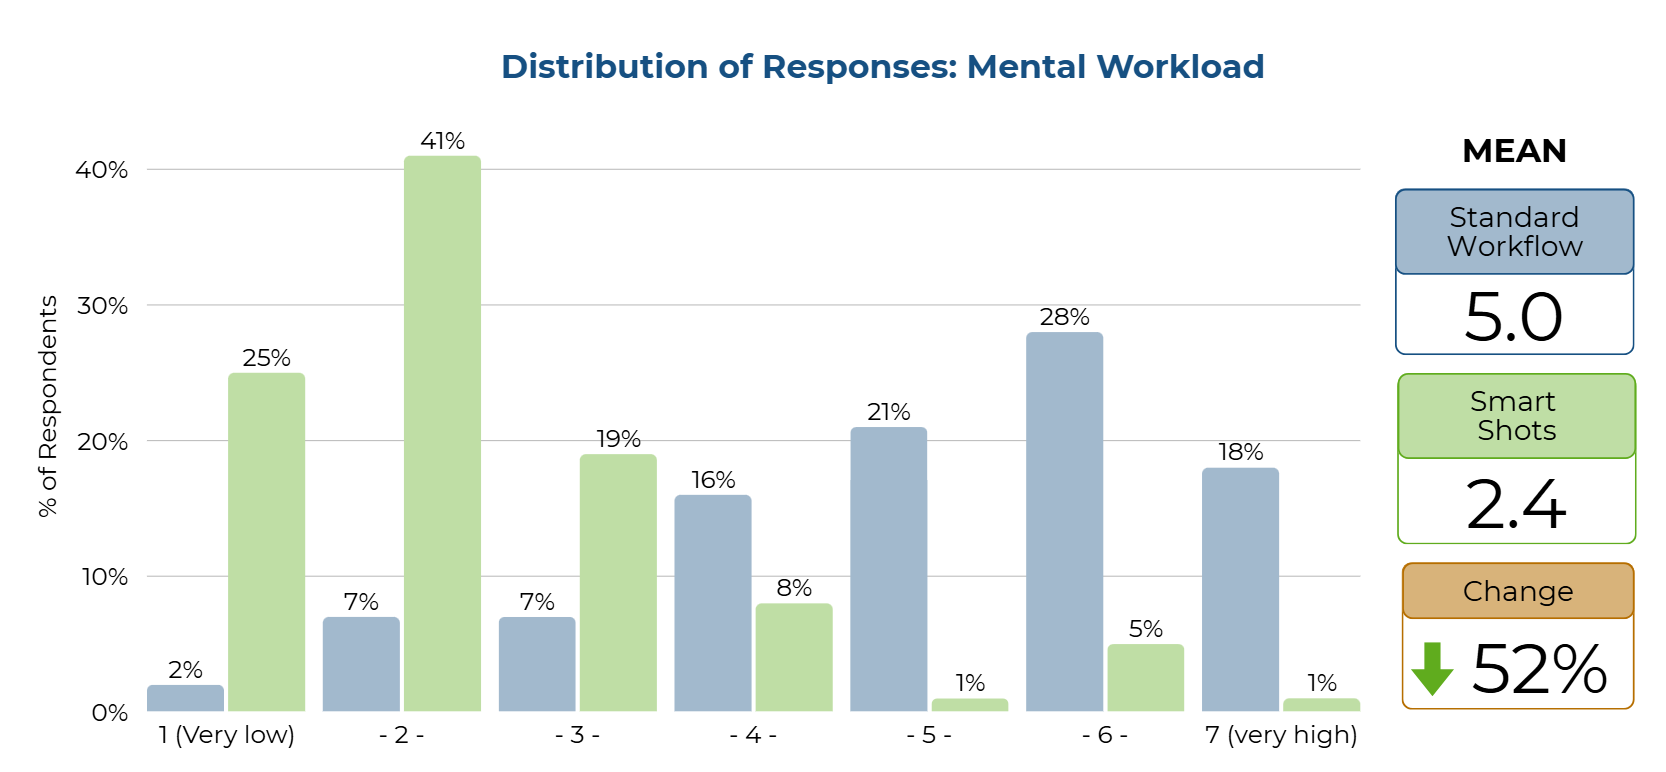
52% Decrease in Cognitive Burden (Mental Workload)
The difference in reported mental workload between the standard EHR workflow and the intervention workflow was measured using a seven-point scale. The mental workload was measured using a single question for each workflow—standard workflow and Smart Shots —on a Likert scale from 1 (least challenging) to 7 (most challenging). Using the standard EHR tools versus Smart Shots, how mentally challenging do you find the work of pediatric immunization management? Responses were 1- the LEAST challenging, up to 7 - the MOST challenging. According to the paired sample t-test, a statistically significant difference was observed between the two ratings of the standard workflow and Smart Shots [t (84) 12.08, p < .001], with ratings for the standard workflow being more challenging (5) compared to less challenging for Smart Shots (2). Clinical significance was demonstrated by a three-point reduction in the mean ratings of the healthcare provider’s mental challenge using the intervention. Further, a Wilcoxon Signed Rank test was conducted and was significant (Z=-7.122, p < .001), eliminating the need to assess any assumptions for the paired t-test.
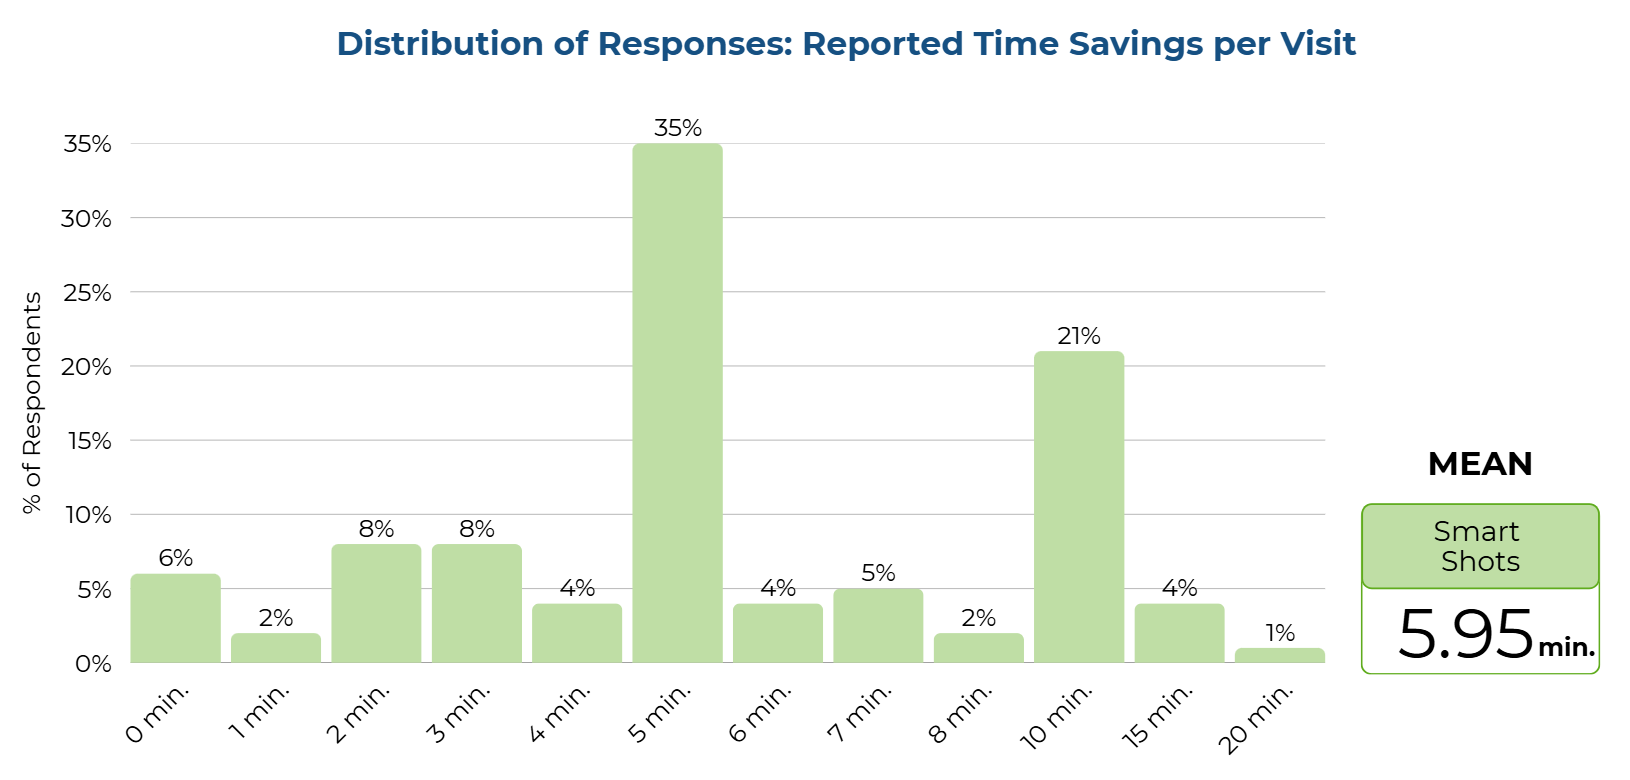
Six Minutes Saved Per Visit
The providers reported their estimated time savings per visit, in minutes, between the standard EHR workflow and the workflow using the Smart Shots intervention. This time savings was reported in Appendix J. The providers rated the Smart Shots report as saving a mean of 5.95 minutes per visit, with a range of 0 to 20 minutes. This time savings was compared with zero time savings using a single-sample t-test and showed a statistically significant time savings for providers using Smart Shots [t (84) = 14.60, p <.001]. Using the Smart Shots intervention resulted in a clinically significant mean time savings of 5.95 minutes, with providers rating a time savings of 0 to 20 minutes, and 94% of providers indicating a time savings greater than zero.
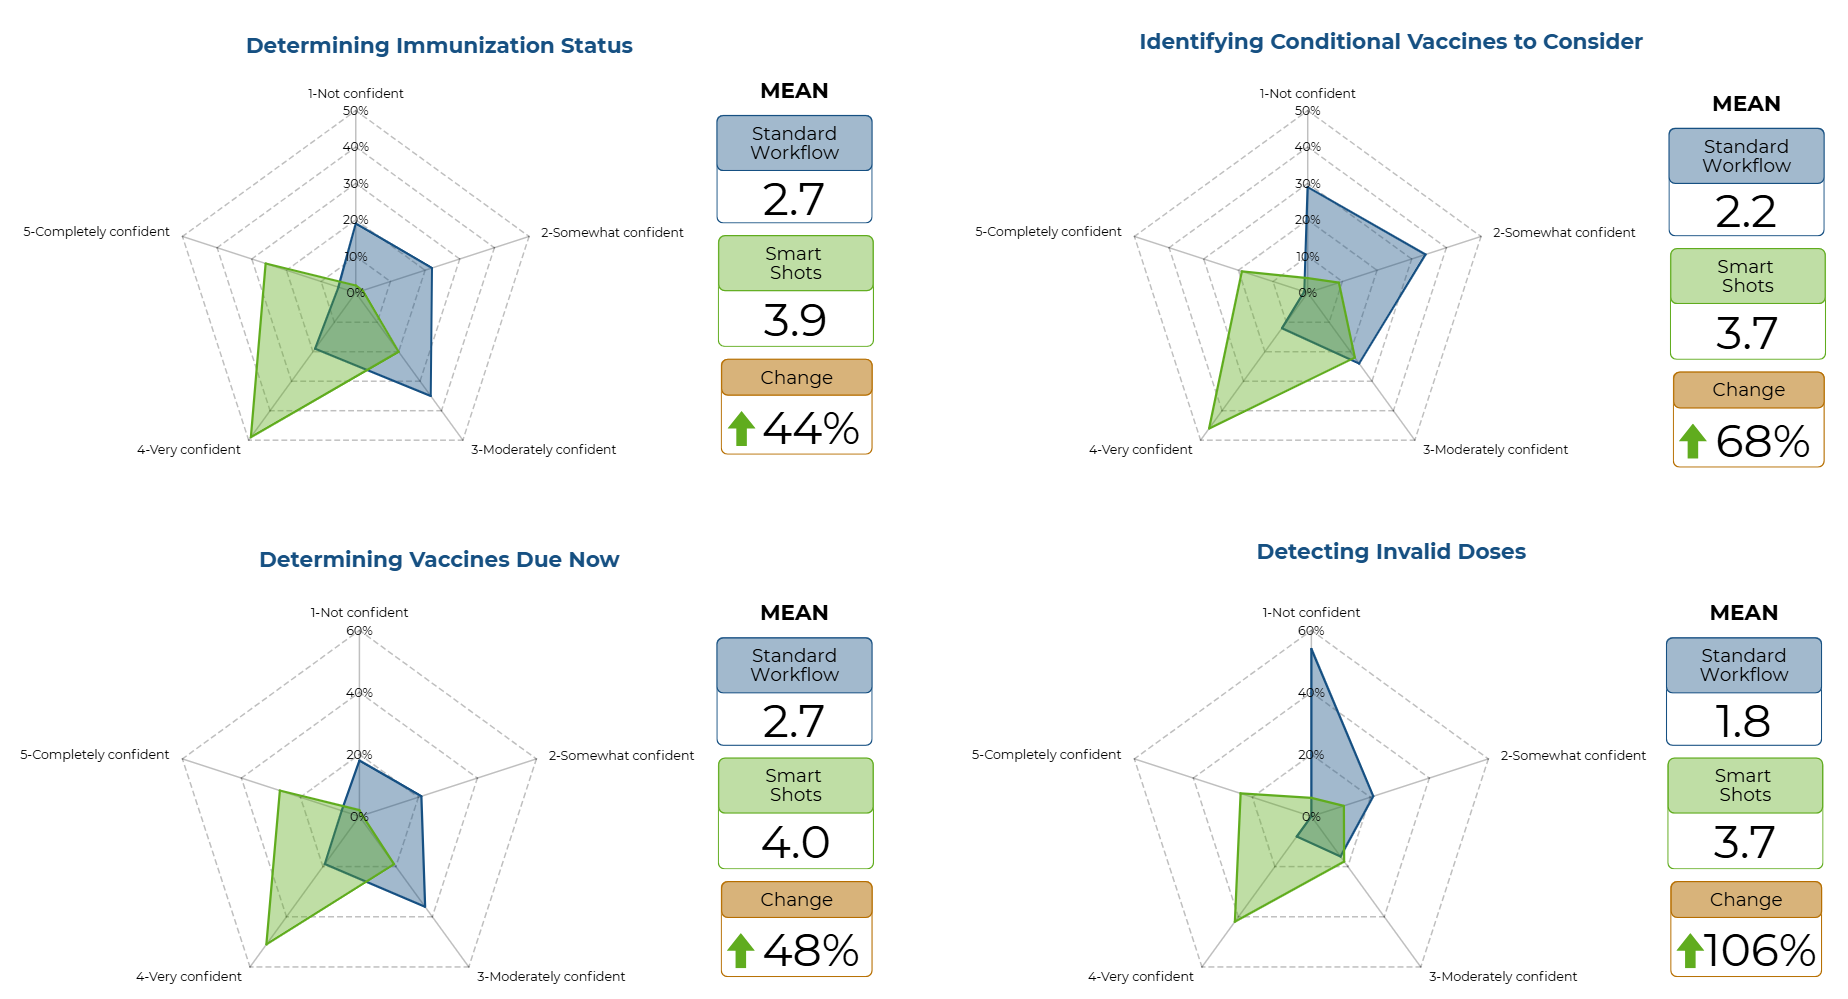
44% to 106% Increase in Provider Confidence
The difference in reported confidence levels when performing specific immunization management tasks was measured using four Likert-scale questions. Confidence was measured using a five-point Likert scale of 1 - Not confident, 2 - Somewhat confident, 3 - Moderately confident, 4 - Very confident, and 5 - Completely confident. An overall confidence score was calculated using the mean of the four responses. The frequencies and mean confidence scores were reported for both the standard workflow and Smart Shots. As noted in Appendix K and Appendix L, all ratings demonstrated that confidence among healthcare providers increased with the implementation of the Smart Shots intervention.
A paired-sample t-test showed a statistically significant increase in overall confidence measured between ratings on standard workflow (Score 2) and Smart Shots (Score 4) [t (84) = -10.44, p <.001] using a p level less than .05 for statistical significance. Further, a Wilcoxon Signed Rank was tested and was significant (Z -6.84, p <.001), eliminating the need to assess any assumptions for the paired t-test. Clinical significance was demonstrated by an increase in overall confidence with performance of immunization management tasks, shown by the provider's ratings changing from somewhat confident (2) to very confident (4). The four questions that asked about the provider’s confidence in immunization tasks were assessed using paired-sample t tests, with all questions showing a statistically significant increase in confidence in immunization status, immunizations due now, conditional recommendations, and invalid dose detection (p < .001) .
Downstream Quality Effects
While the Smart Shots intervention primarily targeted provider outcomes related to cognitive workload and task efficiency, it also enabled analysis of previously unavailable quality measure data. By collecting and analyzing dose evaluations and vaccine forecast changes over time for patients who received the intervention and comparing them with data from non-intervention patients, the project demonstrated notable concurrent improvements in immunization care quality. These findings align with studies indicating that reducing cognitive workload and improving decision-making can positively influence clinical accuracy and care delivery. Since these results were outside the project’s evaluation measure framework, no statistical analysis was conducted.
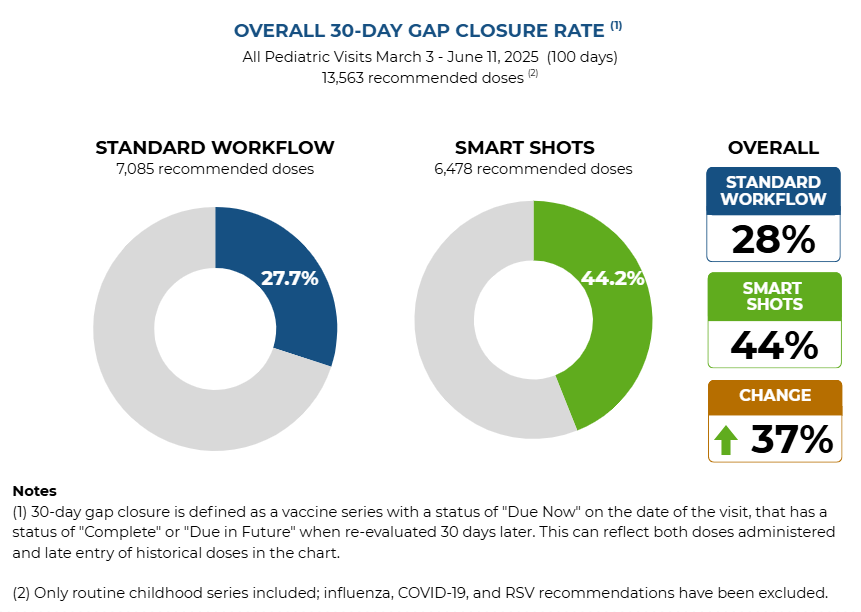
37% Increase in Gap Closures
The comparison of quality metrics between Smart Shots and standard workflow groups during the first 100 days of the project revealed notable differences across three key measures. Immunization gap closure rates rose from 27.7% to 44.2%, representing a 37.4% relative improvement with the Smart Shots intervention. Gap closure was defined as a vaccine series with "Due Now" status at the visit date that achieved "Complete" or "Due in Future" status when re-evaluated 30 days later, capturing both vaccines administered and late entries of historical doses.
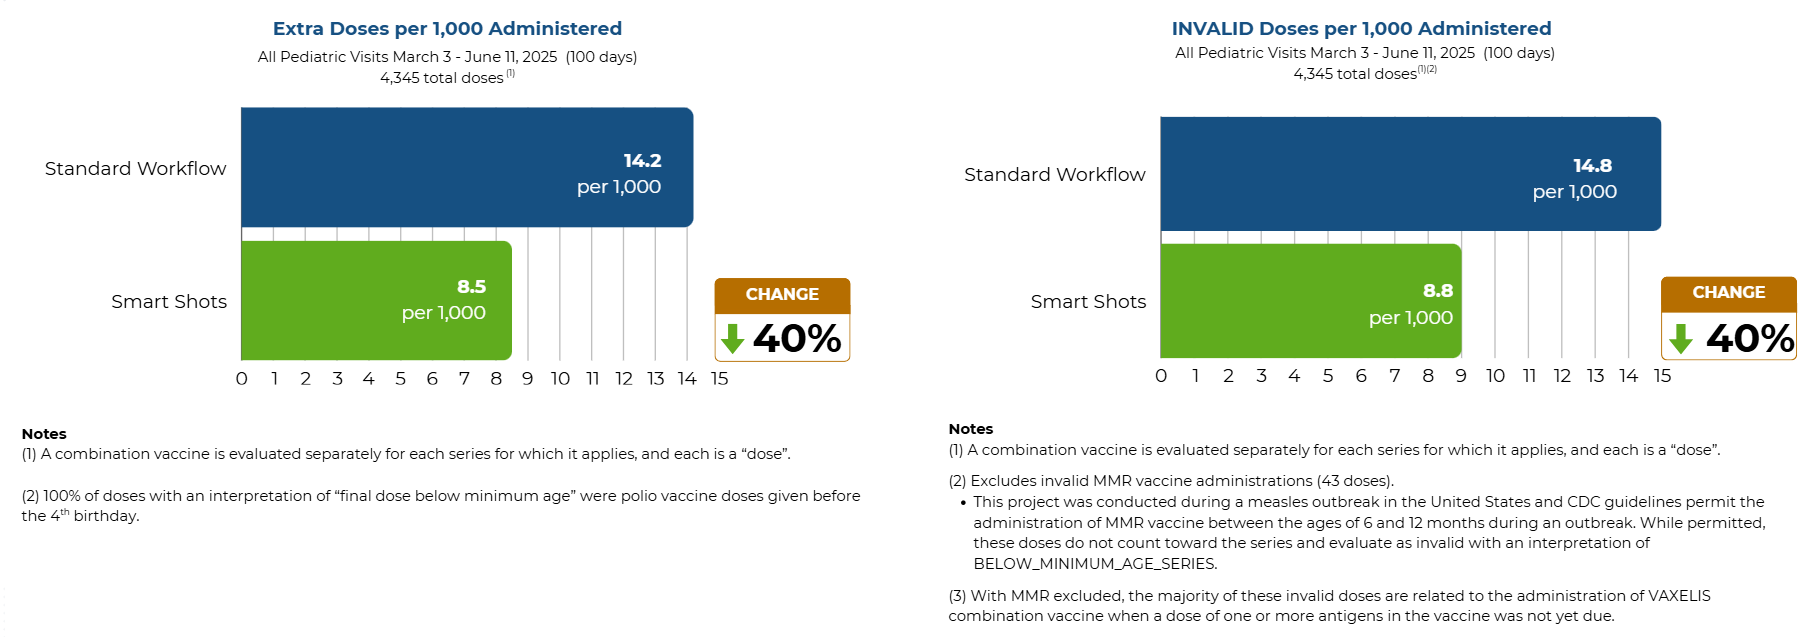
40% Decrease in Invalid and Extra Dose Errors
Administration error rates also decreased with the intervention. Extra-dose administrations, defined as doses given outside a regular series or after series completion when a booster is not indicated, fell from 14.2 to 8.5 per 1,000 vaccine administrations, a 40% decrease. Invalid dose administrations, defined as doses deemed invalid by the CDS engine due to age or timing errors, dropped from 14.8 to 8.8 per 1,000 administrations, a 40% reduction.